


INDIA PRODUCTS
RICE
SPICES
SPICES
A spice is a seed, fruit, root, bark, or other plant substance primarily used for flavoring..
DRY FRUITS
DRY FRUITS
TEA
SEEDS
SEEDS
COOKING OIL
COOKING OIL
ANIMAL FEED
ANIMAL FEED
Feed, also called animal feed, food grown or developed for livestock and poultry..
CEMENT
AUTOMATION COMPONENT
AUTOMATION COMPONENT
Automation is the technology by which a process or procedure is performed with..
MEDICAL EQUIPMENT
MEDICAL EQUIPMENT
INDIA OVERVIEW
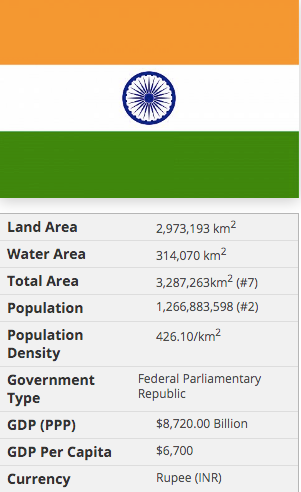
Strategically located near highly populated trading partners including China, Pakistan and Bangladesh, the Republic of India shipped US$323.1 billion worth of goods around the globe in 2018. That dollar amount reflects a 1.7% improvement since 2014 and a 9.2% gain from 2017 to 2018.
From a continental perspective, almost half (49.3%) of Indian exports by value were delivered to fellow Asian countries. Another 19.3% was sold to European importers while 18% went to North America. Smaller percentages went to Africa (8.3%), Latin America (2.9%) excluding Mexico but including the Caribbean, then Oceania (1.3%) led by Australia.
Given India’s population of 1.297 billion people, its total $323.1 billion in 2018 exports translates to roughly $250 for every resident in the vast South Asian country.
In macroeconomic terms, India’s total exported goods represent 3.1% of its overall Gross Domestic Product for 2018 ($10.505 trillion valued in Purchasing Power Parity US dollars). That 3.1% for exports to overall GDP per PPP in 2018 compares to 4.4% for 2014, seeming to indicate a relatively decreasing reliance on products sold on international markets for India’s total economic performance. And while this article focuses on exported goods, it is interesting to note that India also provided $205.1 billion worth of exports-related services to global customers for an additional 2% of GDP in PPP.
Another key indicator of a country’s economic performance is its unemployment rate. India’s unemployment rate was 3.53% for 2018, according to Trading Economics.
INDIA MAP
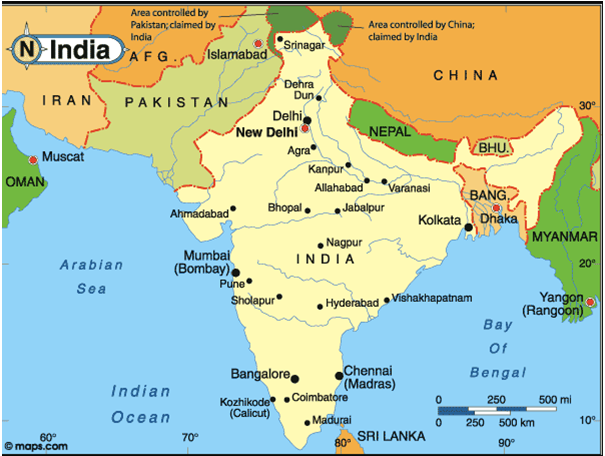
INDIA'S LARGEST CITIES (2019)
Mumbai, New Delhi , Bangalore, Kolkata, Chennai, Ahmedabad, Hyderabad, Pune
INDIA TOP TEN EXPORT PRODUCTS
The following export product groups represent the highest dollar value in Indian global shipments during 2018. Also shown is the percentage share each export category represents in terms of overall exports from India.
- Mineral fuels including oil: US$48.3 billion (14.9% of total exports)
- Gems, precious metals: $40.1 billion (12.4%)
- Machinery including computers: $20.4 billion (6.3%)
- Vehicles: $18.2 billion (5.6%)
- Organic chemicals: $17.7 billion (5.5%)
- Pharmaceuticals: $14.3 billion (4.4%)
- Electrical machinery, equipment: $11.8 billion (3.6%)
- Iron, steel: $10 billion (3.1%)
- Cotton: $8.1 billion (2.5%)
- Clothing, accessories (not knit or crochet): $8.1 billion (2.5%)
India’s top 10 exports accounted for just over three-fifths (61%) of the overall value of its global shipments.
Mineral fuels including oil was the fastest growing among the top 10 export categories, up 34.5% from 2017 to 2017. Notably, exports of Indian refined petroleum oils and electrical energy were behind this acceleration.
Close behind in second place for improving Indian export sales was electrical machinery and equipment which gained 33.9%.
India’s shipments of organic chemicals recorded the third-fastest gain in value up 30.7% year over year, ahead of the 22.5% sales expansion for the machinery including computers category.
There were three declining top categories for Indian exports: iron and steel via its -14.7% drop, clothing and accessories (down -9.6%) then gems and precious metals (down -5.8%) mainly due to India’s plummeting international sales of gold.
INDIA TOP IMPORTS
The following product groups represent the highest dollar value in India’s import purchases during 2018. Also shown is the percentage share each product category represents in terms of overall imports into India.
- Mineral fuels including oil: US$168.6 billion (33.2% of total imports)
- Gems, precious metals: $65 billion (12.8%)
- Electrical machinery, equipment: $52.4 billion (10.3%)
- Machinery including computers: $43.2 billion (8.5%)
- Organic chemicals: $22.6 billion (4.4%)
- Plastics, plastic articles: $15.2 billion (3%)
- Iron, steel: $12 billion (2.4%)
- Animal/vegetable fats, oils, waxes: $10.2 billion (2%)
- Optical, technical, medical apparatus: $9.5 billion (1.9%)
- Inorganic chemicals: $7.3 billion (1.4%)