


IRAN PRODUCTS
SAFFRON
SAFFRON
Saffron is a spice derived from the flower of Crocus sativus ,commonly known as the “saffron crocus”..
DRY FRUITS
DRY FRUITS
Pistachios are a great source of healthy fats, fiber, protein, antioxidants and various nutrients..
CONSTRUCTIONS
CONSTRUCTIONS
Gypsum powder (Calcium sulfate Dihydrate/ Hydrous Calcium Sulfate) is a smooth..
PETROCHEMICALS
PETROCHEMICALS
Petrochemical, in the strictest sense, any of a large group of chemicals (as distinct from fuels)..
KIWI
COUNTRY PROFILE
Sharing its eastern borders with Pakistan and Afghanistan, the Islamic Republic of Iran shipped US$96.6 billion worth of goods around the globe in 2018. That dollar amount reflects a 7% increase since 2014 and a 5.3% gain from 2017 to 2018.
The latest available country-specific data shows that 60.5% of products exported from Iran were bought by importers in: China (14.7% of the global total), Iraq (14.3%), United Arab Emirates (9.5%), Afghanistan (4.7%), South Korea (4.1%), Turkey (3.8%), India (3.3%), Pakistan (2.0%), Indonesia (1.3%), Oman (1.2%), Thailand (1.1%) and Azerbaijan (0.7%).
Given Iran’s population of 83 million people, its total $96.6 billion in 2018 exports translates to roughly $1,200 for every resident in the Middle Eastern country.
In macroeconomic terms, Iran’s total exported goods represent 4.1% of its overall Gross Domestic Product for 2018 ($1.611 trillion valued in Purchasing Power Parity US dollars). That 4.1% for exports to overall GDP in PPP for 2018 compares to 4.9% for 2014, seeming to indicate a relatively decreasing reliance on products sold on international markets for Iran’s total economic performance. And while this article focuses on exported goods, it is interesting to note that Iran also provided $10.6 billion worth of exports-related services to global customers for an additional 0.7% of GDP in PPP.
Another key indicator of a country’s economic performance is its unemployment rate. Iran’s unemployment rate was 12.2% at March 2019 up from 12.1% one year earlier, according to Trading Economics.
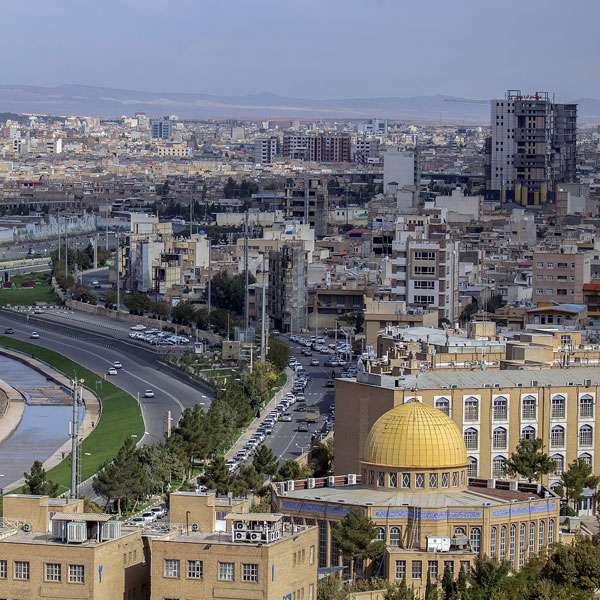
IRAN OVERVIEW
Sharing its eastern borders with Pakistan and Afghanistan, the Islamic Republic of Iran shipped US$96.6 billion worth of goods around the globe in 2018. That dollar amount reflects a 7% increase since 2014 and a 5.3% gain from 2017 to 2018.
The latest available country-specific data shows that 60.5% of products exported from Iran were bought by importers in: China (14.7% of the global total), Iraq (14.3%), United Arab Emirates (9.5%), Afghanistan (4.7%), South Korea (4.1%), Turkey (3.8%), India (3.3%), Pakistan (2.0%), Indonesia (1.3%), Oman (1.2%), Thailand (1.1%) and Azerbaijan (0.7%).
Given Iran’s population of 83 million people, its total $96.6 billion in 2018 exports translates to roughly $1,200 for every resident in the Middle Eastern country.
In macroeconomic terms, Iran’s total exported goods represent 4.1% of its overall Gross Domestic Product for 2018 ($1.611 trillion valued in Purchasing Power Parity US dollars). That 4.1% for exports to overall GDP in PPP for 2018 compares to 4.9% for 2014, seeming to indicate a relatively decreasing reliance on products sold on international markets for Iran’s total economic performance. And while this article focuses on exported goods, it is interesting to note that Iran also provided $10.6 billion worth of exports-related services to global customers for an additional 0.7% of GDP in PPP.
Another key indicator of a country’s economic performance is its unemployment rate. Iran’s unemployment rate was 12.2% at March 2019 up from 12.1% one year earlier, according to Trading Economics.
IRAN MAP
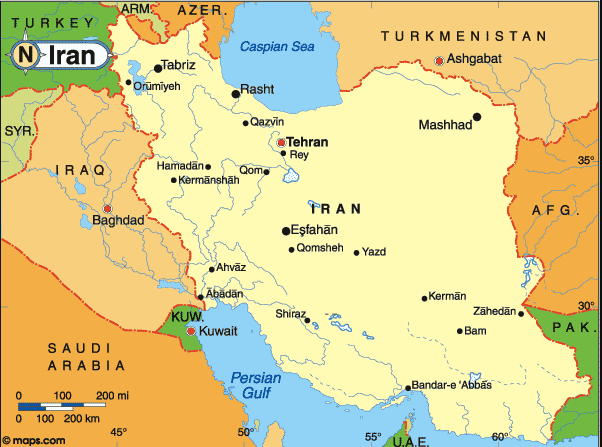

IRAN’S LARGEST CITIES (2019)
Tehran, Mashhad, Isfahan, Karaj, Tabriz, Shiraz, Qom, Ahvaz, Kahriz, Kermansha
IRAN’S TOP TEN EXPORTS
He following export product groups represent the highest dollar value in Iranian global shipments during 2018. Also shown is the percentage share each export category represents in terms of overall exports from Iran.
- Mineral fuels including oil: US$66.4 billion (68.7% of total exports)
- Plastics, plastic articles: $5.6 billion (5.7%)
- Organic chemicals: $4.1 billion (4.2%)
- Iron, steel: $3.9 billion (4%)
- Fruits, nuts: $1.7 billion (1.8%)
- Ores, slag, ash: $1.1 billion (1.2%)
- Vegetables: $1.1 billion (1.1%)
- Fertilizers: $843.7 million (0.9%)
- Salt, sulphur, stone, cement: $785.2 million (0.8%)
- Copper: $700.6 million (0.7%)
IRAN TOP IMPORTS
The following product groups represent the highest dollar value in Iran’s import purchases during 2017. Also shown is the percentage share each product category represents in terms of overall imports into Iran.
- Machinery including computers: US$7.7 billion (18.6% of total imports)
- Cereals: $4.4 billion (10.5%)
- Electrical machinery, equipment: $3.7 billion (8.9%)
- Pharmaceuticals: $1.6 billion (3.8%)
- Vehicles: $1.5 billion (3.7%)
- Oil seeds: $1.5 billion (3.7%)
- Optical, technical, medical apparatus: $1.4 billion (3.4%)
- Organic chemicals: $1.4 billion (3.4%)
- Plastics, plastic articles: $1.3 billion (3.1%)
- Iron, steel: $1.2 billion (2.9%)